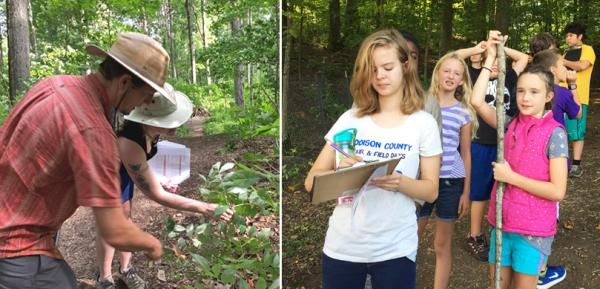
Phenology and Climate at the Farm
Phenology is the study of cyclic and seasonal natural phenomena and events. Events might include: When does a plant flower? When does it set fruit? When do migrating birds arrive north each spring? When do animals begin hibernating?
These annual milestones and rhythms are important to farmers, hunters, foragers, gardeners and many others. They also can help us understand how species are interconnected with their environments. And this understanding comes in handy if climate change starts nudging relationships out of sync (more on that later).
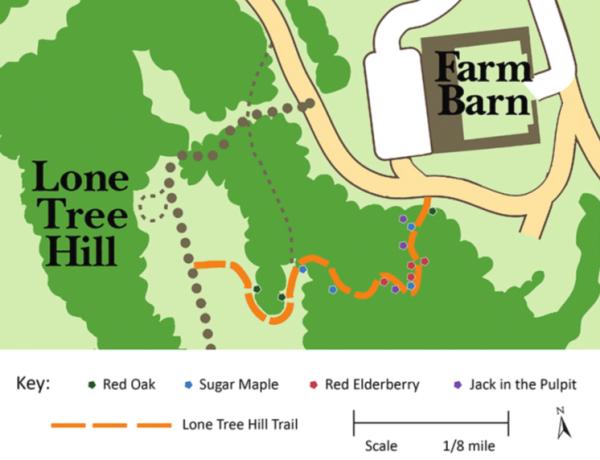
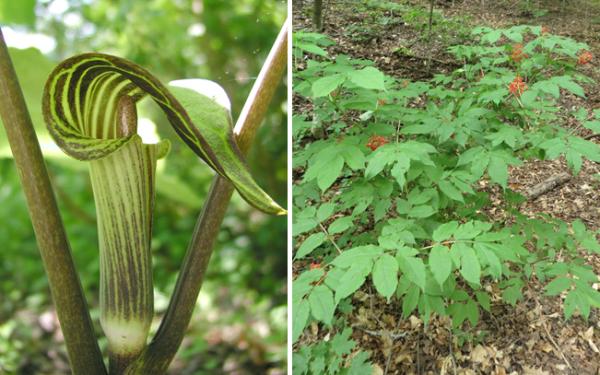
Last summer, we worked with a graduate student in UVM’s Field Naturalist program, Chelsea Clarke, to develop a phenology trail. Along our Lone Tree Hill trail, Chelsea flagged fourteen plants of four different species that can be monitored over time: Red Oak, Sugar Maple, Red Elderberry, and Jack in the Pulpit.
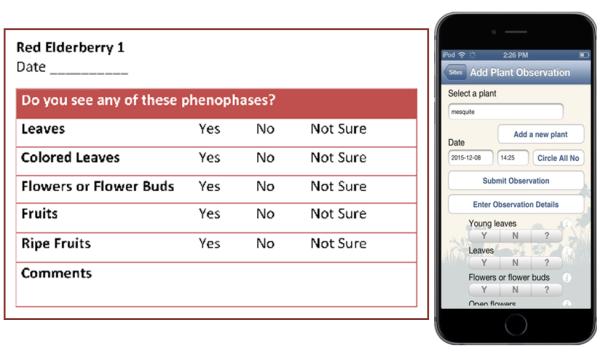
Together, we came up with a simple, family-friendly system for collecting data on these plants. It’s based on yes or no questions: “Do you see flowers? Yes/No.” The questions were borrowed from the National Phenology Network, a growing group of scientists and interested people who submit phenology data from monitoring sites around the country. (It’s where our Farm data will go.) Their website also has some great visual tools to help interpret the data.
Individuals are encouraged to collect as much information about a species as possible, but it is okay if you can’t gather it all, every data point is useful. Participants observe for recurring events in a plant’s life cycle, like flowers blooming, pollen being released, or the appearance of ripe fruits. These different stages are called phenophases. With Chelsea’s help, we narrowed our questions down to the basic phenophases that are easiest for students to detect.
The hope is that Shelburne Farms visitors will join in this effort, too, to learn a bit more about the local natural history and the impacts of climate change in our area. Walking the trail and monitoring the plants might be a one-time experience for visitors from far away or a repeat experience for community members, like the students and teachers from Endeavor Middle School. (They jumped at the chance to be our first regular data collectors!)
So how does phenology (and how might our trail), give us insight into a changing climate?
Warming temperatures can kick out of sync the cycles of interdependent species. For example, hummingbirds pollinate red elderberry here in Vermont. The birds’ spring migration north is triggered by lengthening days, and day length should stay relatively constant even as the planet warms. Hummingbirds will continue to show up on schedule. But if warmer temperatures make red elderberry bloom earlier, before the birds arrive, the plants won’t get pollinated. Then there will be no fruit. Then the rodent that might depend on that fruit to fatten up for hibernation is going to have a problem. So small changes can cascade through the food web.
These kinds of mismatches are known as: “phenological asynchronies.” Phenological data can help us better understand -- and maybe respond to -- the changes we’re seeing in the natural world. Observing seasonal changes in local plants and animals is also simply a tangible, age-appropriate way to build skills and understanding for approaching the complexities of climate change as students get older.
Our new phenology trail isn’t just a data collection project for the Farm, it’s also a model for what educators can set up on their school campuses. Last summer, interested educators in our Climate Resiliency Fellowship and our Education for Sustainability course spent an afternoon on the phenology trail monitoring the plants; practicing the data collection methods; and linking the whole activity to the Next Generation Science Practices. They were envisioning how this type of outdoor science activity can complement and augment their classroom lessons, and they batted around ideas on how to scale the monitoring for students young and old (e.g., building in more complex critical thinking and technological tools for high schoolers). The cross-discipline ideas they came up with were amazing, from sharing seasonal storybooks to collaborating on thought provoking science journal questions!

